Understanding Carbon Budgets
I am personally not a friend of carbon budgets, as they convey the impression that there is a safe limit to carbon emissions. This is simply not true at this point: every additional ton of CO2 entering the atmosphere will make us more miserable.
More importantly, the often-quoted carbon budgets for a specific temperature only give us certain probability of staying below. A recent publication by Knutti et al contains a nice summary of carbon budgets, which I have turned into the plot below.

The blue curve represents the probability of staying below 1.5°C of warming as a function of cumulative carbon emission, starting from the beginning of 2020. If we want a 50% probability of staying below this limit, the carbon budget was 443 Gt. If we want an 80% probability, the remaining carbon budget was 0 Gt and for a 95% probability, the budget was -307 Gt.
In other words, there is already far too much CO2 in the atmosphere. Even if we stopped emissions today, there is still no guarantee that we will stay below 1.5°C.
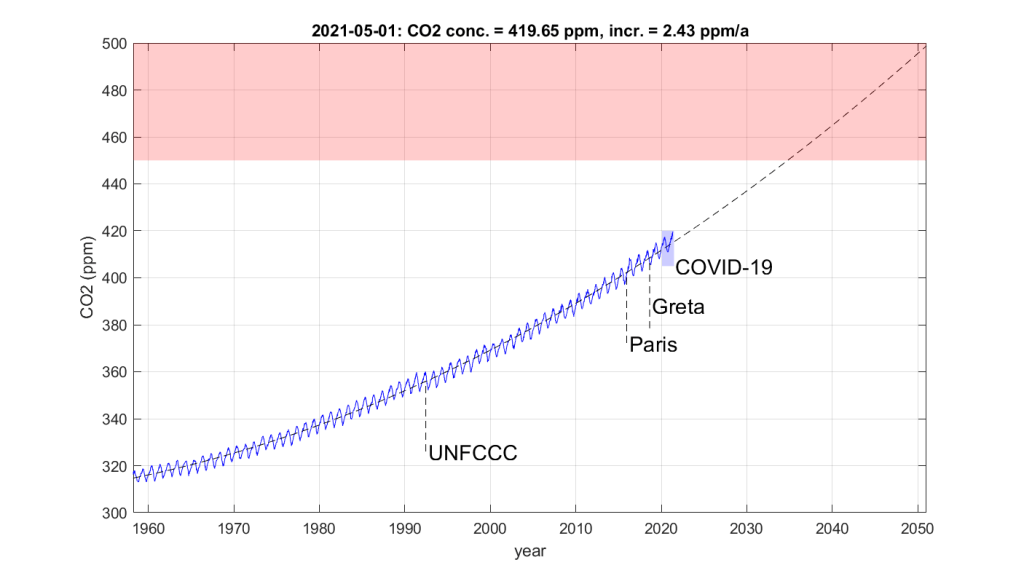
BTW, below is my latest update of the Keeling curve, including data up to the beginning of May, 2021. Obviously, the are still no signs that the carbon concentration will peak anytime soon, as the annual rate of increase is still increasing. Put differently, we are heading for the precipice and have not yet decided to take the foot off the accelerator. Applying the brake is still completely out of the question.


